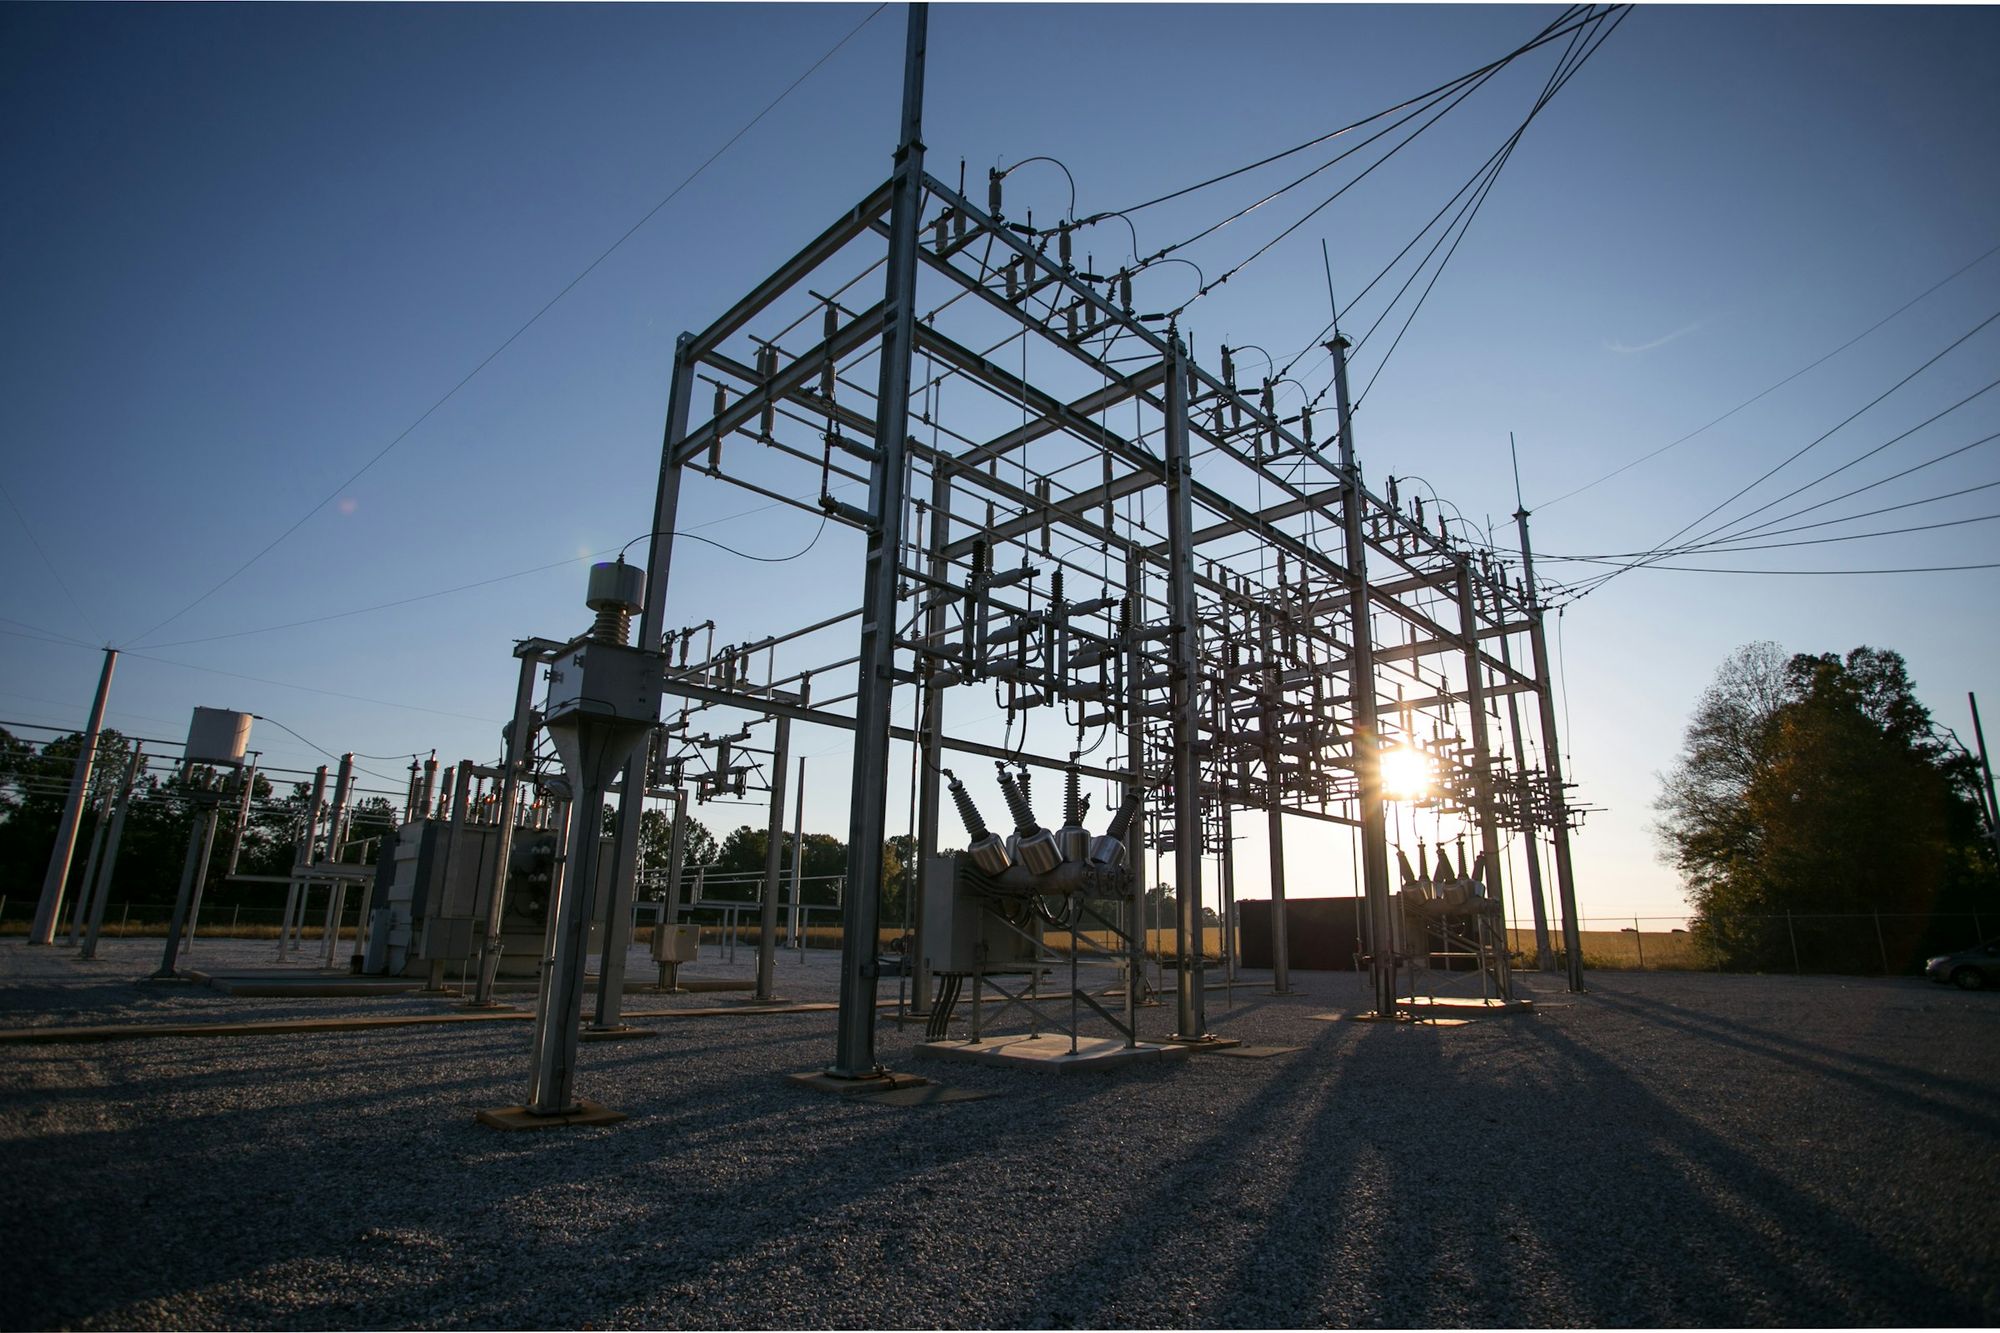
Every source on its own
Solar has an app, the generator has a panel and the grid has a bill.
Solar, generators, batteries and the grid, measured against what your site actually uses.
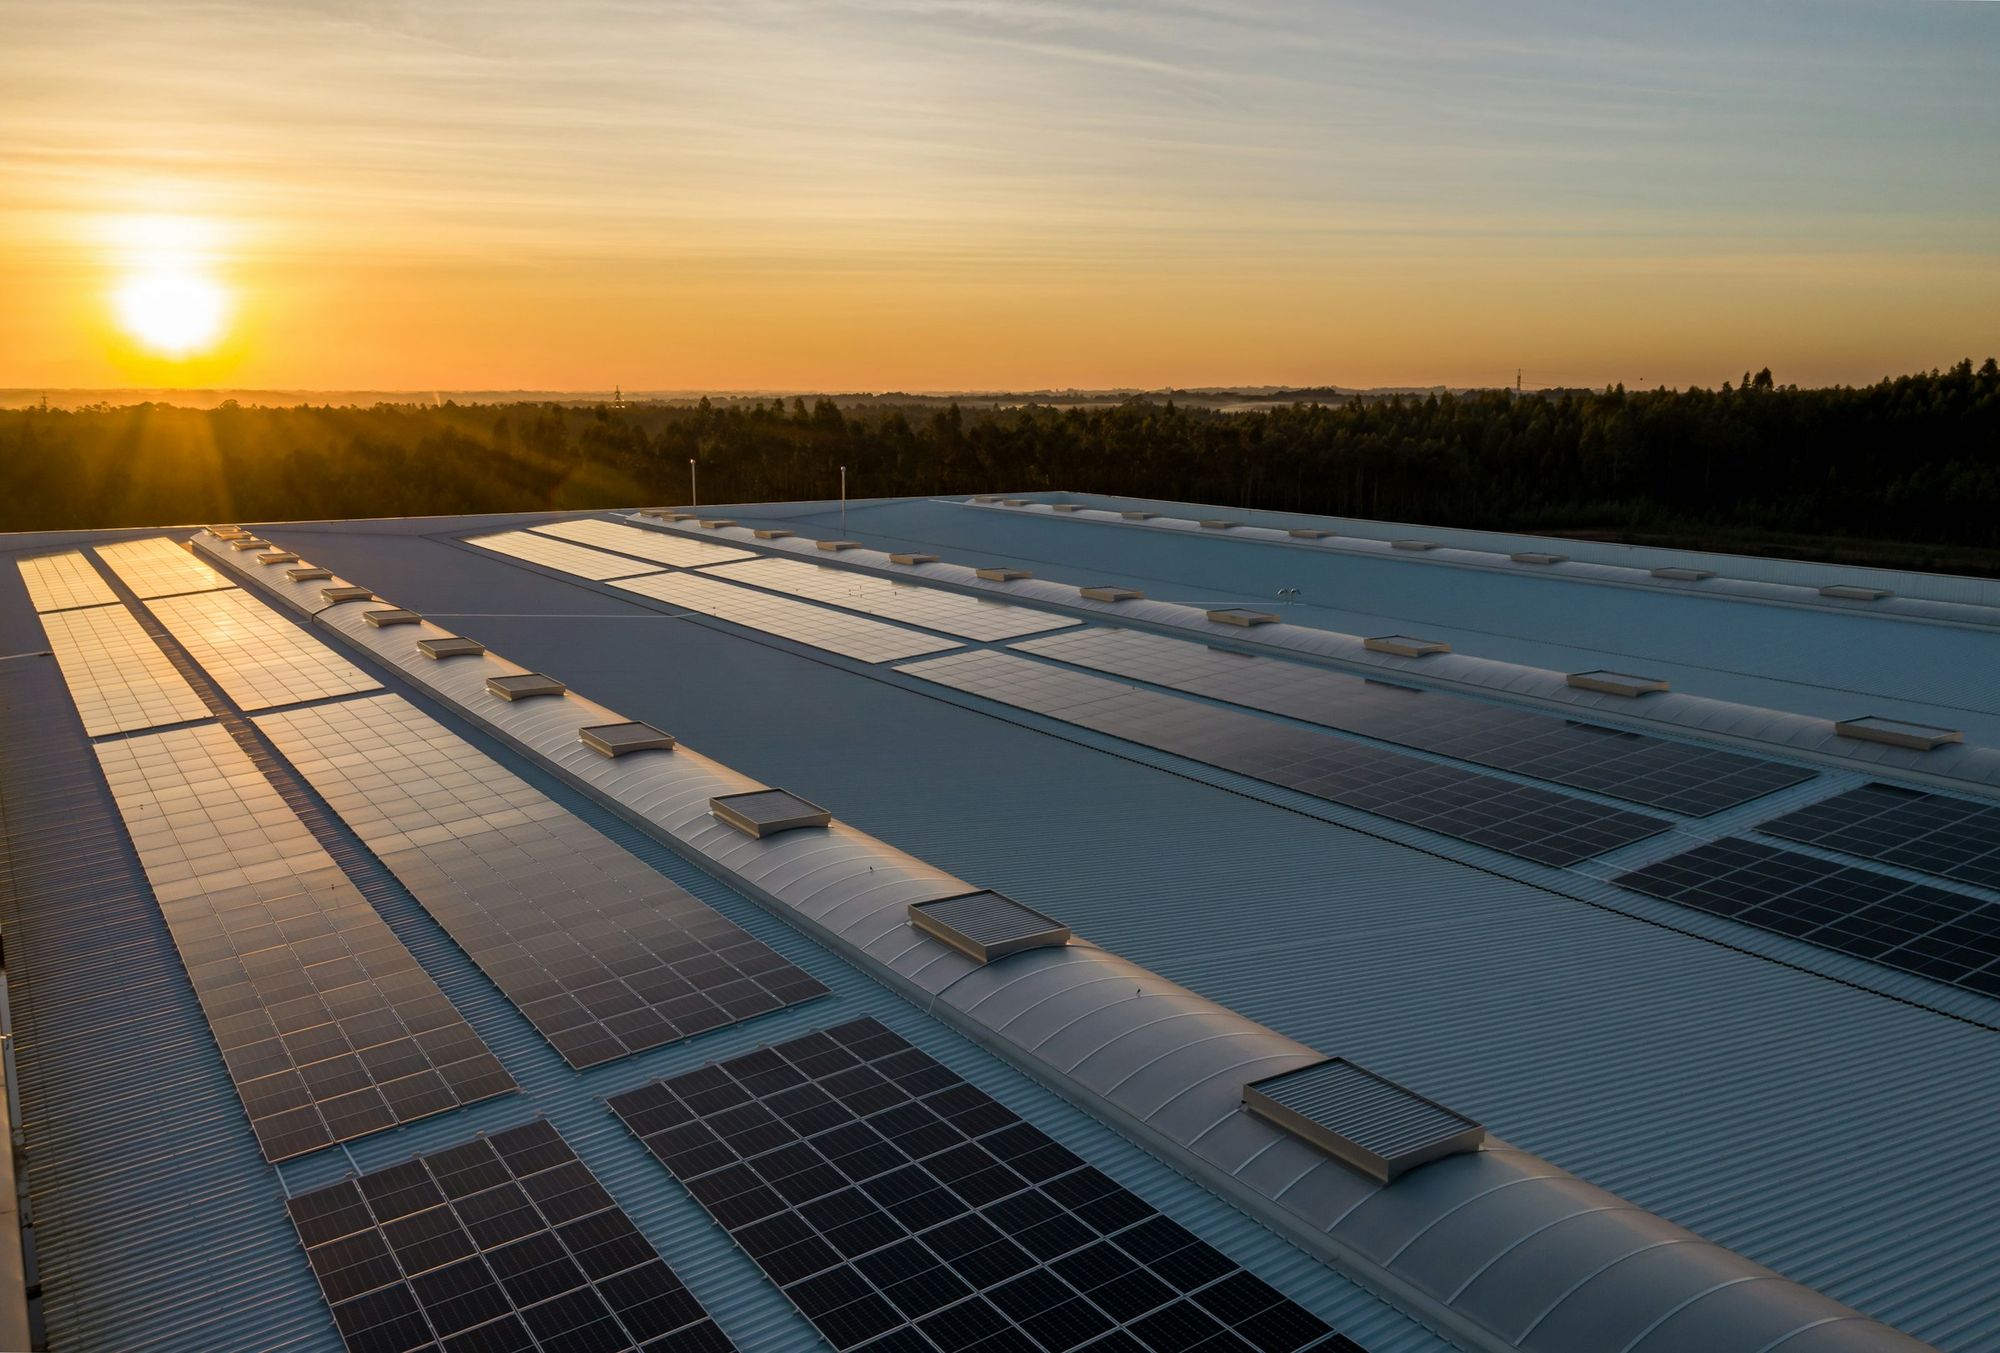
The panels, the generator and the grid meter all tell a different story.
Solar has an app, the generator has a panel and the grid has a bill.
Nobody can say how much of what the roof makes the factory actually uses.
A peak shows up on the bill a month later, when nothing can be done.
Reactive power and energy quality issues are hard to prove without data.
The battery charges and discharges the same way, whatever the day brings.
An inverter can be off for days before anyone on site looks at it.
One place for the energy team, facilities and finance.
Solar, generators, meters and batteries, from data loggers and file imports.
02 WatchGeneration, consumption, meters and a single-line diagram of the site.
03 CatchAlarms when output falls short or data stops coming in.
04 FixTickets and recurring tasks for your team or contractor.
05 ReportEnergy and cost in monthly reports and Excel exports.
See where the site's power comes from, where it goes and what it costs.
Each sees what their job needs.
Your energy manager sets up the site, users and alarm rules.
Your facilities team gets alarms and works tickets. Never sees earnings.
Your finance team reads energy cost and reports, read-only.
Site leadership follows output and cost across sites, read-only.
One factory or a campus of buildings, on the same platform.
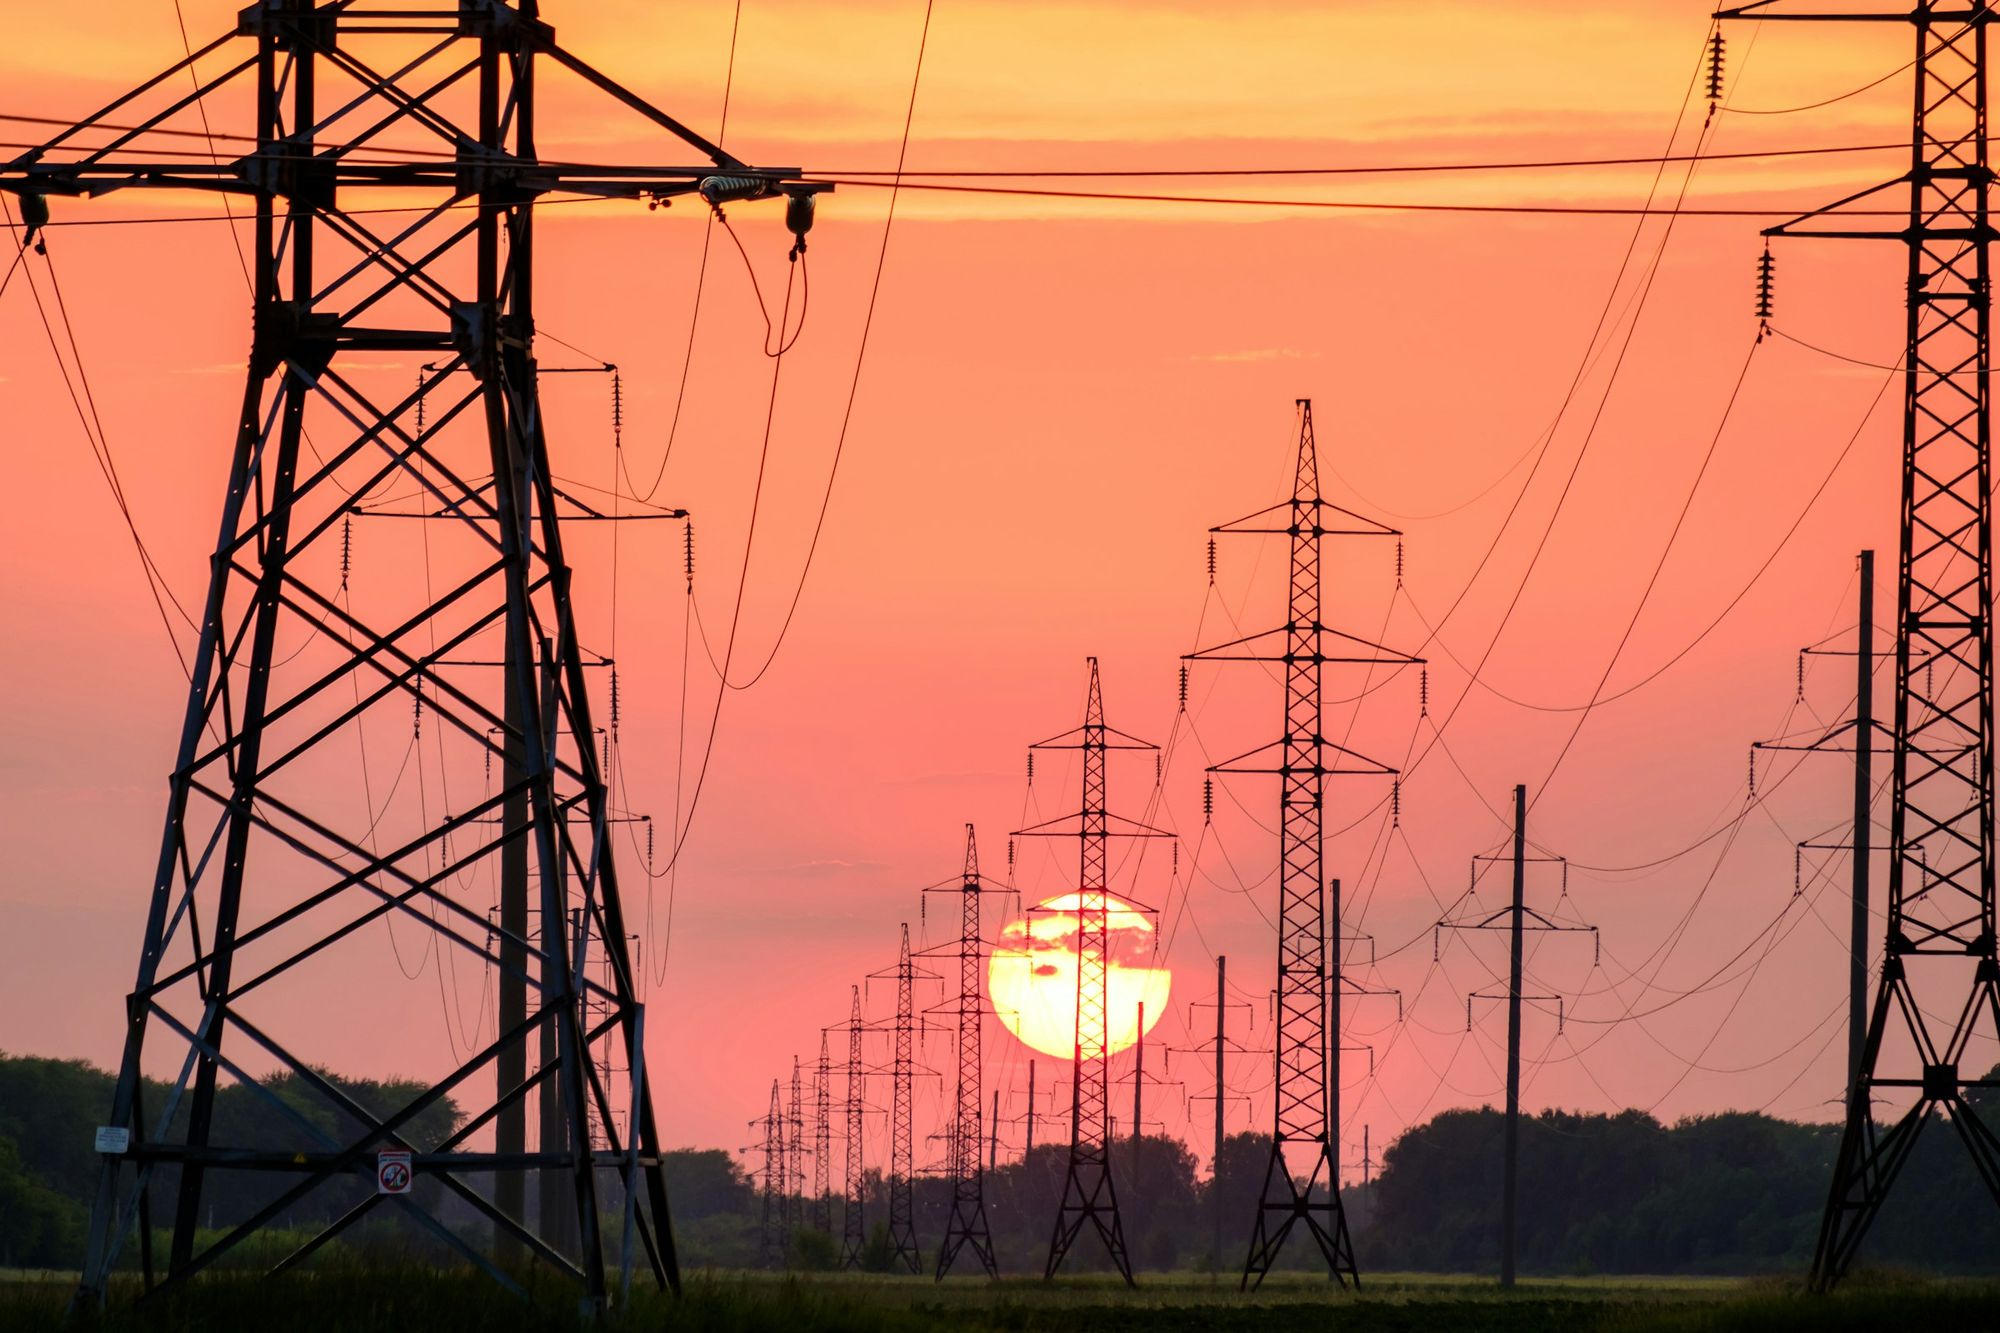
Yes. Generation, consumption, demand, reactive power and energy quality sit next to each other for the whole site.
Yes. Energy management sets when batteries charge and discharge.
You set unit prices by month, and cost is the unit price times the energy.
Yes. Every site sits in one portfolio, with a list, a map and an overview.
A walkthrough of GridMarshal for your factory or campus.