Meters
Grid, generation and consumption meters next to the plant data.
See every plant you run live, from the whole fleet down to a single string.
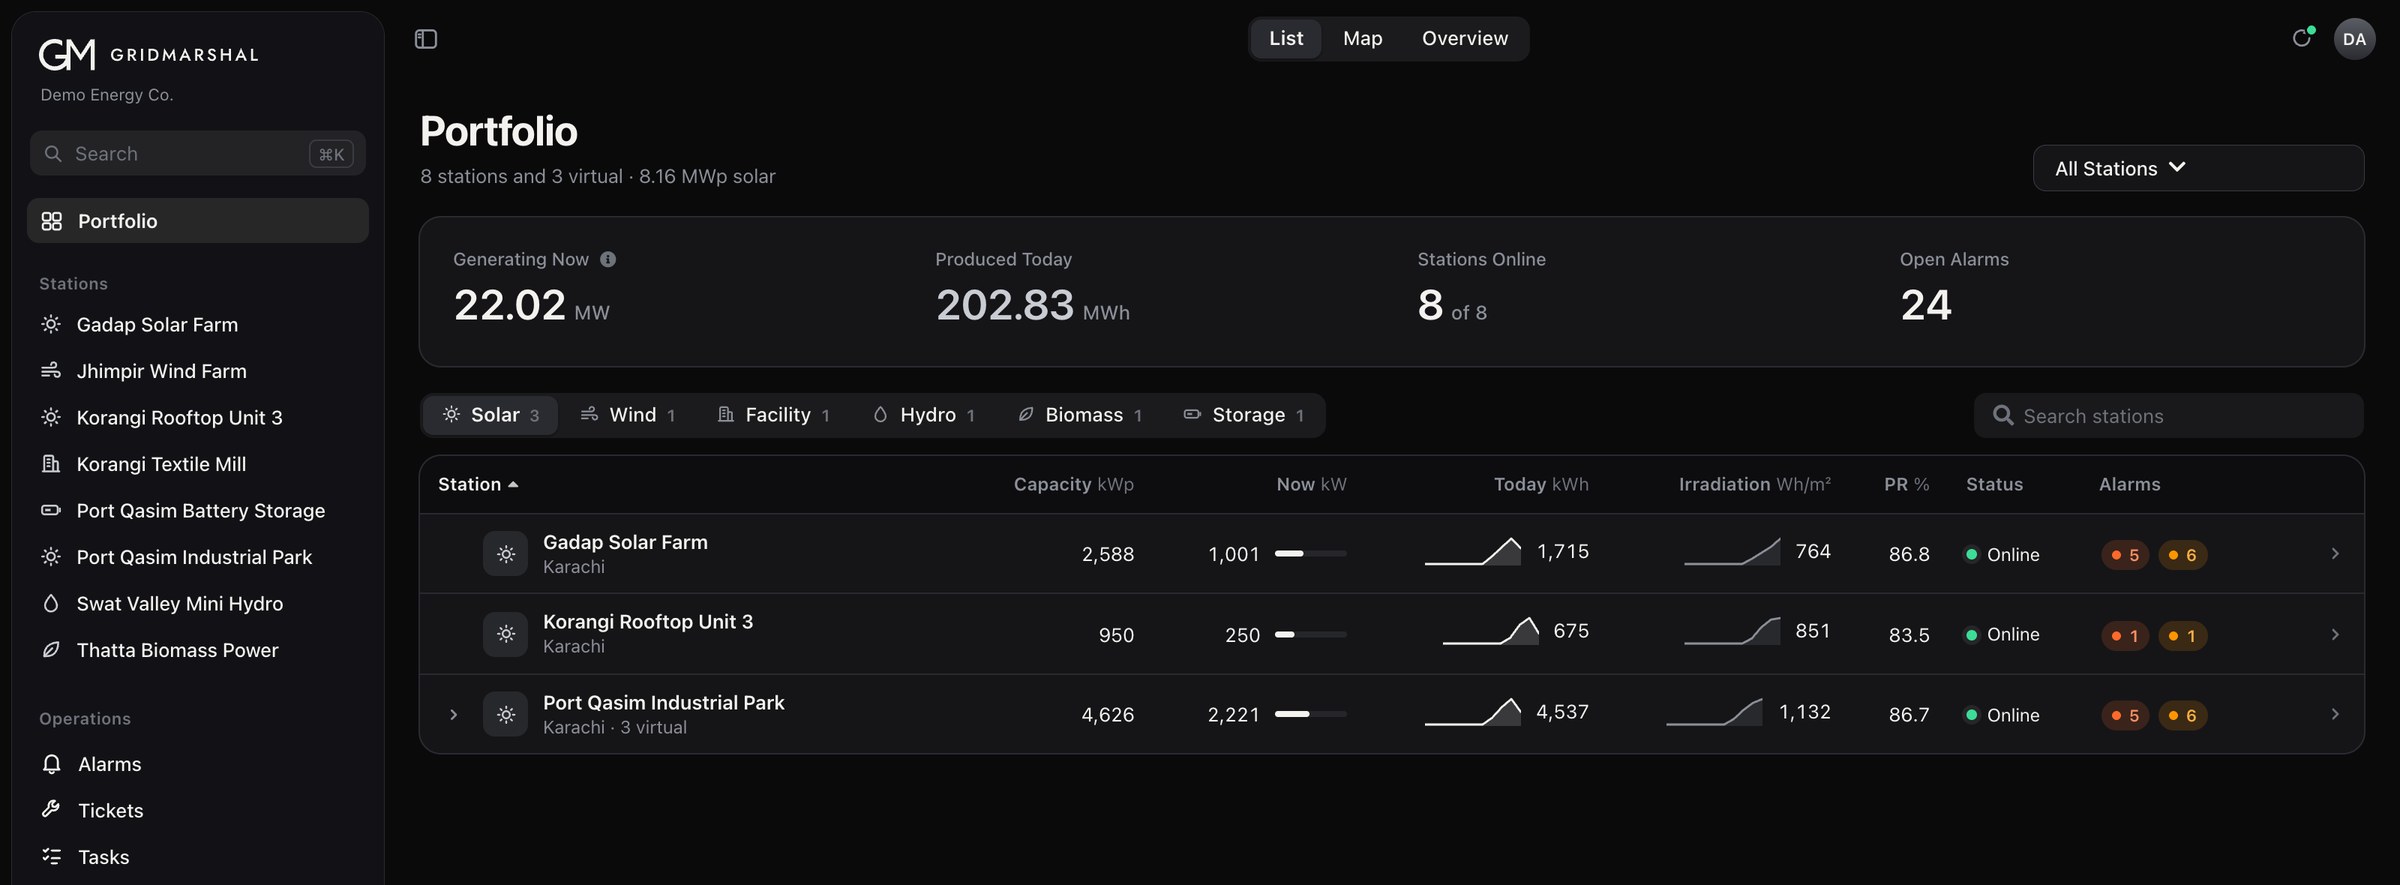
Output, performance ratio, status and open alarms for each plant, side by side.
Start wide, then follow the number down until you find the cause.
Every plant you are given, as a list, a map or an overview.
Station overview for each plant.
Each inverter normalised, by yield and by availability.
Each string compared with the mean of its neighbours.
Colour shows kW per kWp, so a plant of any size reads the same way.
Each string is compared with the mean, and sorted into three clear bands.
The string is in line with the mean. Nothing to do.
Worth a look on the next visit. Soiling or shading often starts here.
The string is losing energy now. Find out why.
Meters, inputs and the electrical layout, live in the same place.
Grid, generation and consumption meters next to the plant data.
The electrical layout of the plant, with live values on it.
Signals from site equipment, shown as they change.
The latest values from site, as they arrive.
What the plant is expected to make, alongside what it makes.
Efficiency views for the plant and its equipment.
The same formulas on every plant, so every plant can be compared.
Calculated to IEC 61724-1.
PR with the effect of module temperature taken out.
Time producing while irradiance is above 200 W/m².
In kWh and MWh, by day, month and year.
Measured in W/m² at the plant.
The emissions each plant keeps out of the air.
Unit price times energy. Hidden from technicians.
The same KPIs in daily and monthly PDFs.
Every source of power you run, watched the same way.
The questions teams ask before they connect their first plant.
Data loggers upload over SFTP, which is encrypted, or FTP, each with its own account. Files can be imported, and SolarEdge plants connect through the SolarEdge cloud API. History can be back-filled.
Each user only sees the plants they are given. A plant can also be shared read-only with another company, such as an owner or an investor.
Yes. The phone app installs on Android and iPhone and shows stations, live output, production and open alarms. About the phone app
Performance ratio follows IEC 61724-1. A temperature-corrected PR is shown as well.
A walkthrough of monitoring, from your portfolio down to a single string.