

Every plant type
Not just solar.
Six kinds of plant, one way of working: the same alarms, work orders and reports across all of them.
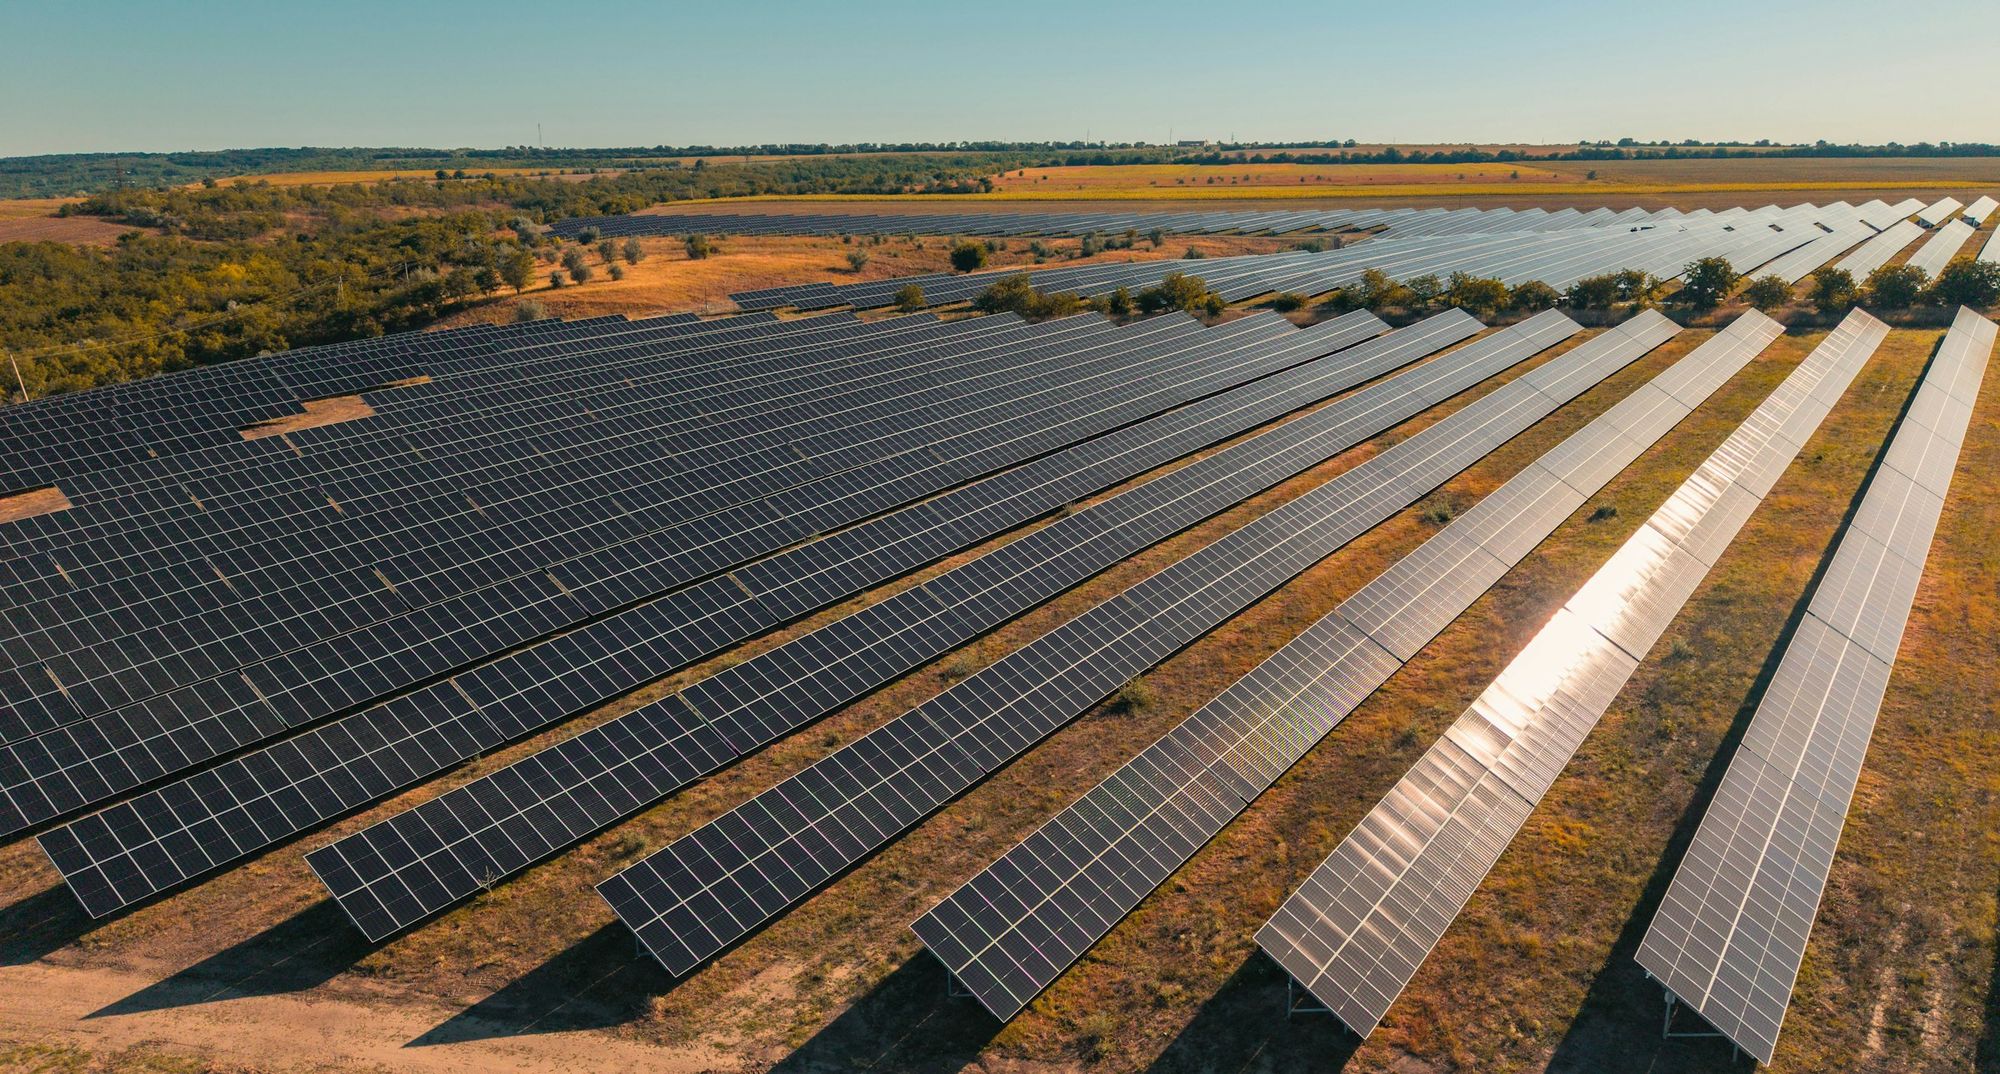
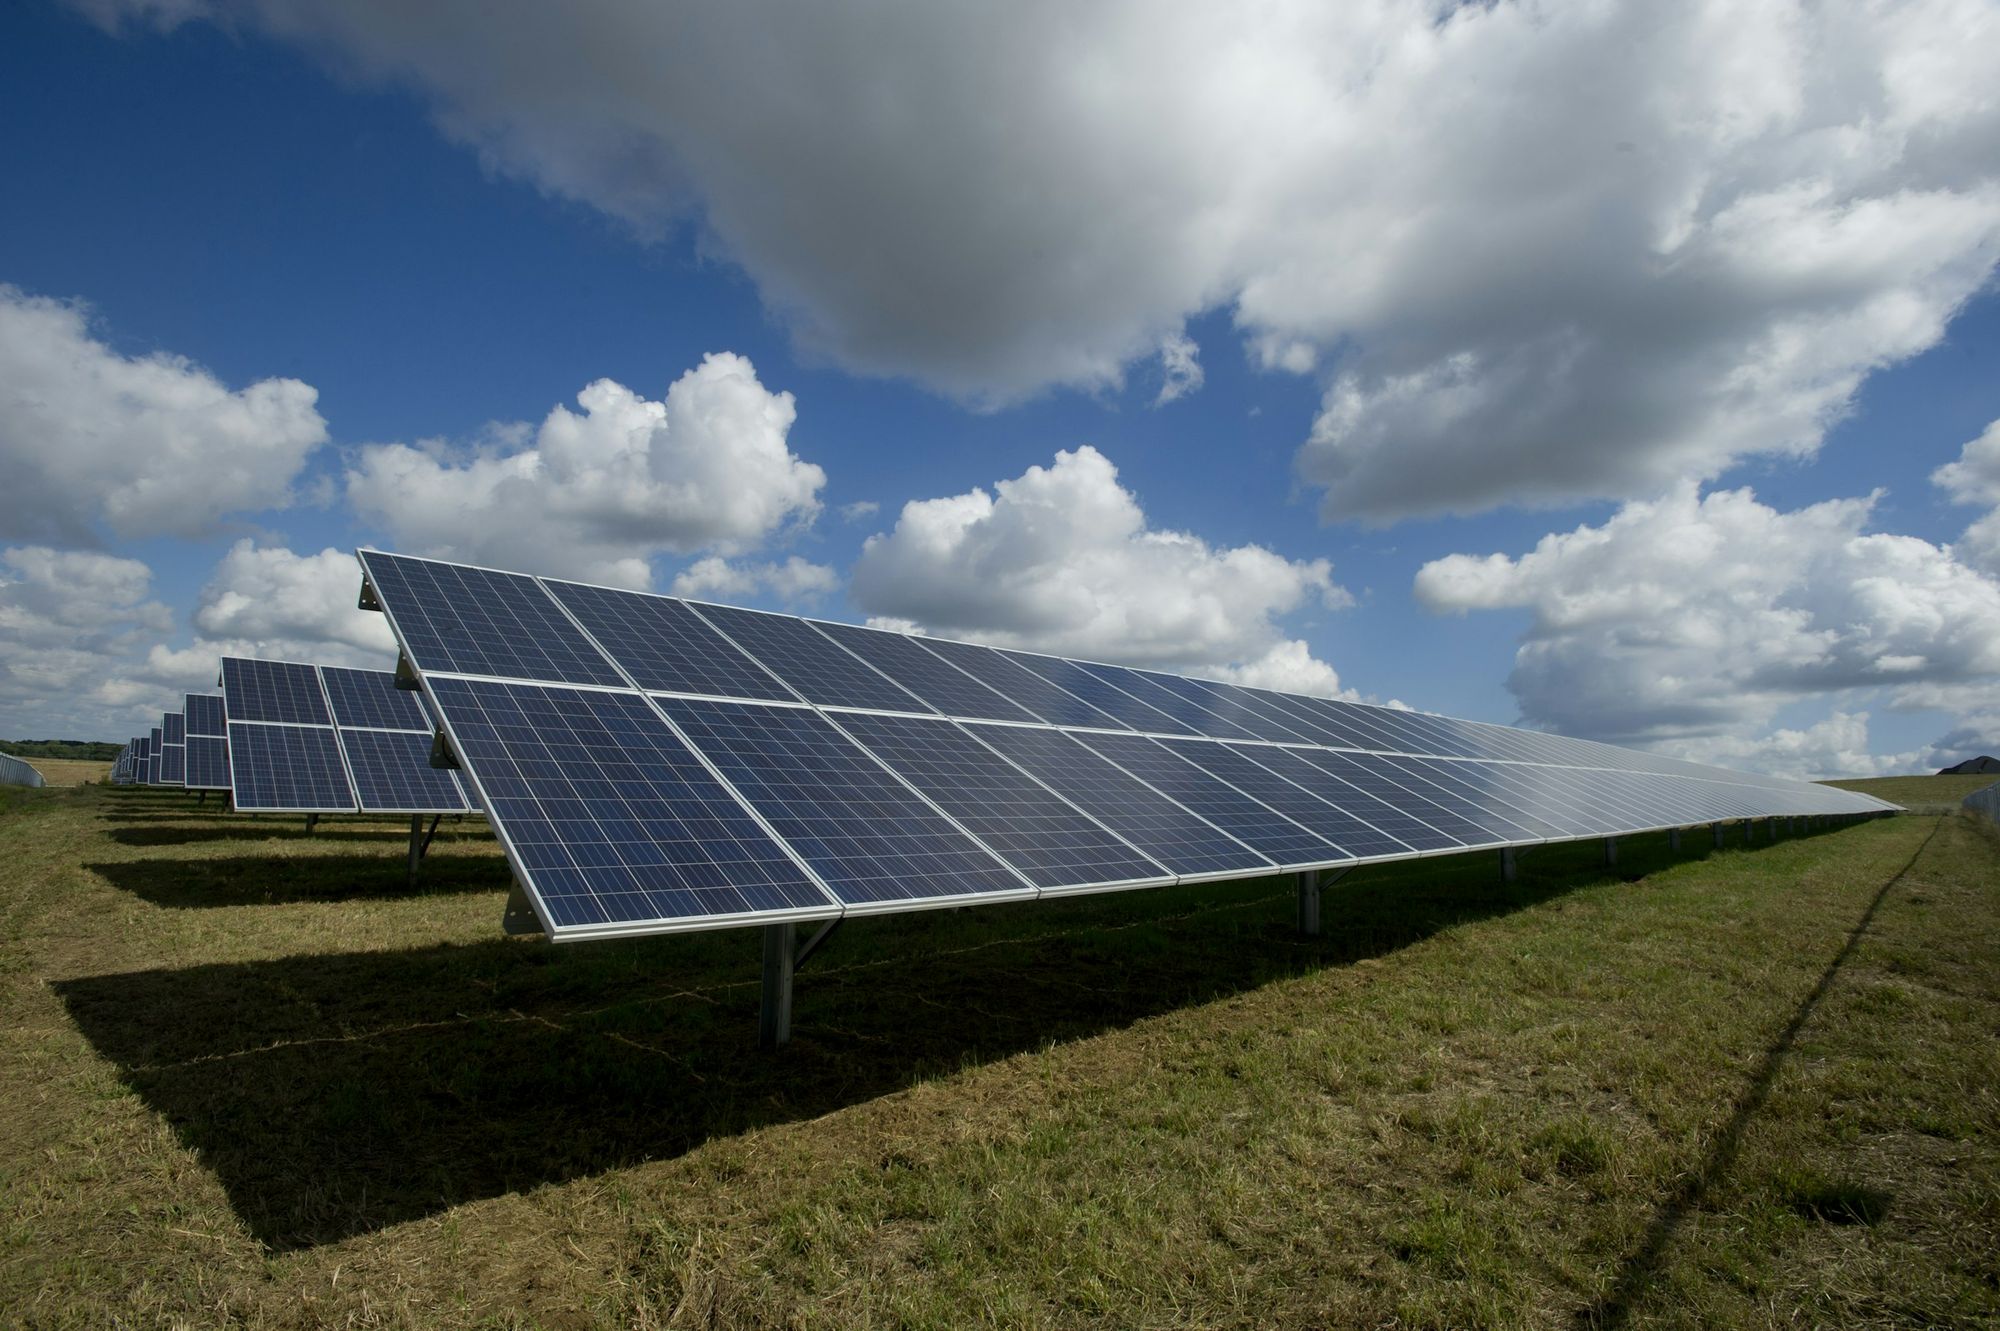
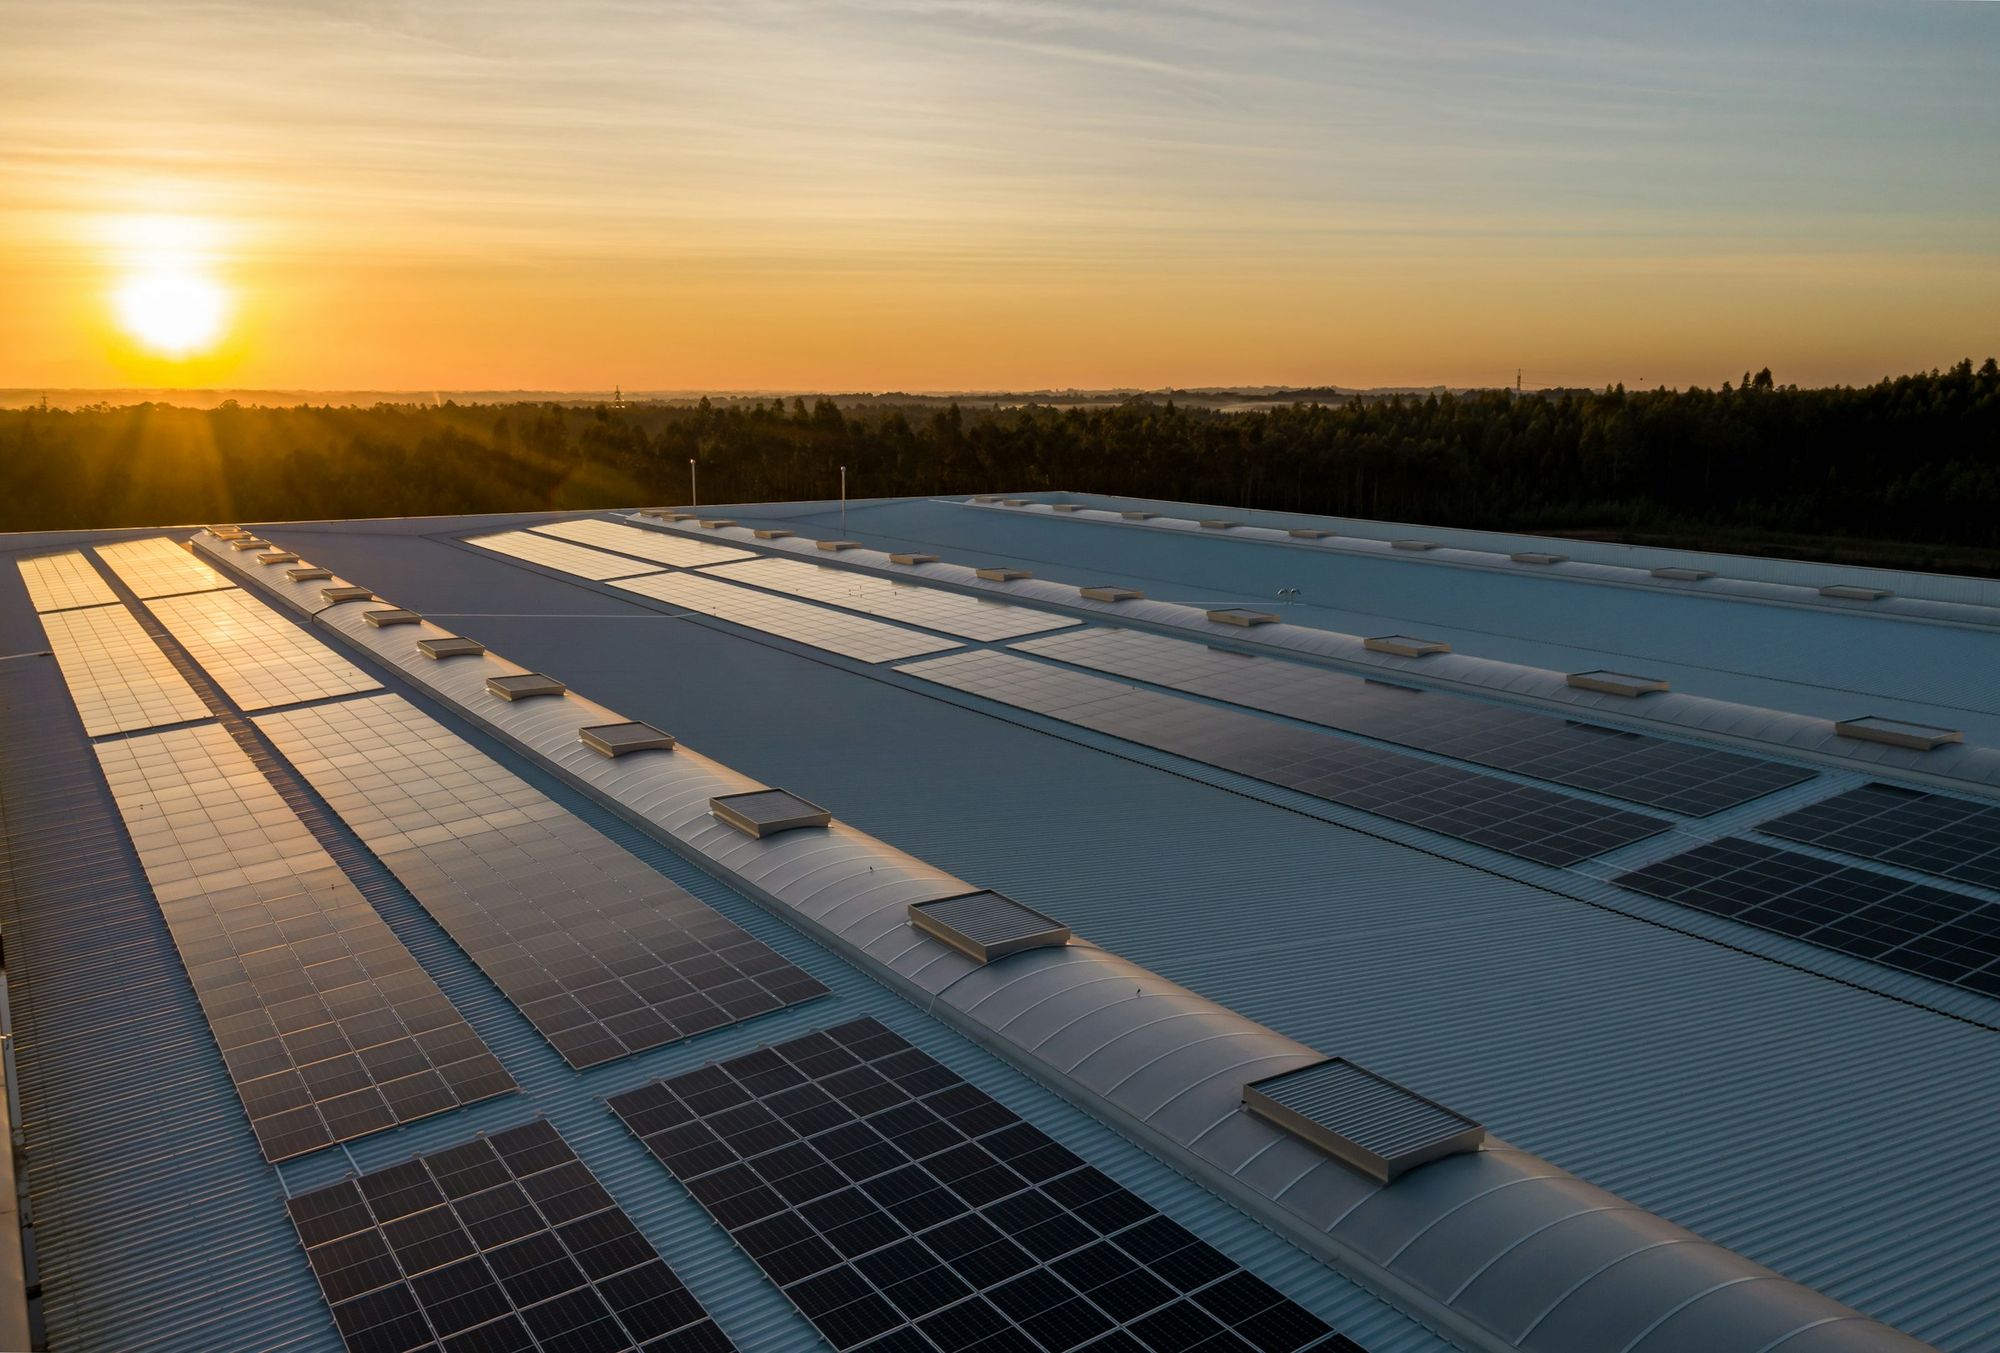
01 Solar
Down to a single string.
Find the tripped string or the lazy inverter before it costs a month of output.
- Heat maps of inverters and strings, coloured by kW per kWp
- String evaluation: each string against the mean, green within 5 percent, yellow within 10, red beyond
- Expected output per inverter against actual, with a deviation alarm
- Performance ratio to IEC 61724-1, also temperature-corrected
IrradianceAvailability above 200 W/m²ForecastEfficiency
02 Wind
Wind farms in the same view.
Wind output sits next to your other plants, not in a separate portal.
- Live output next to your other plants
- Plant status and energy produced
- Meters and the single-line diagram
- Alarm rules and communication alarms
Tickets with energy lossRecurring tasksMonthly reports

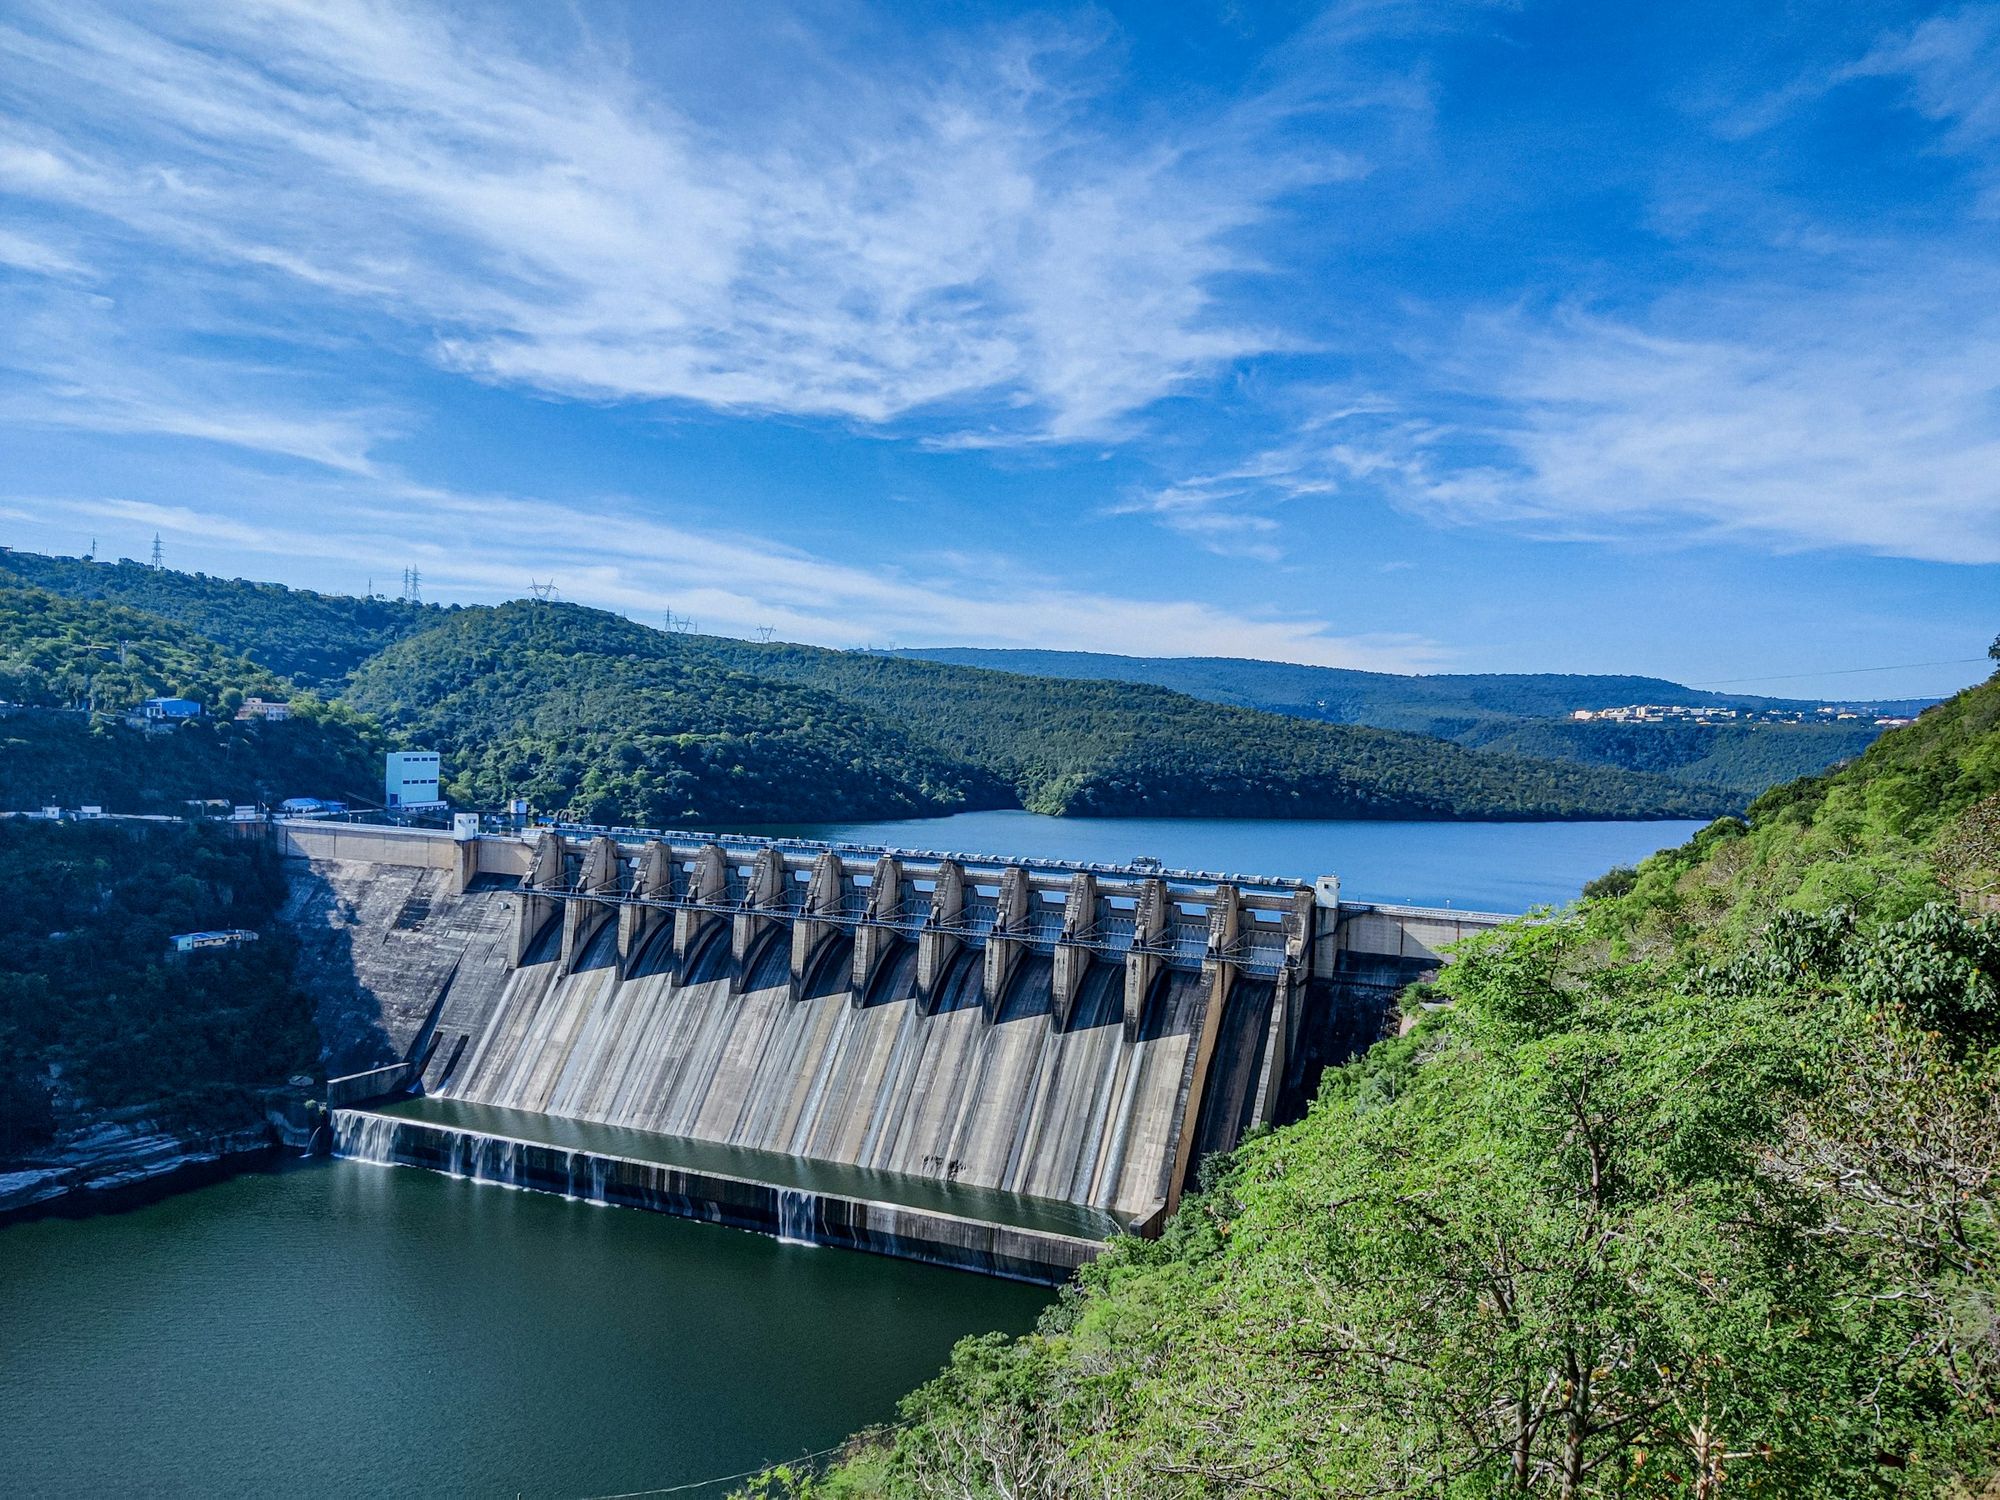
03 Hydro
Steady plants, watched as closely.
Know when a hydro plant stops making what it should.
- Output and energy, live and by day, month and year
- Digital inputs for on and off states from site equipment
- Meters and the single-line diagram
- Plant status and energy produced
Alarm escalationSpare partsExcel export
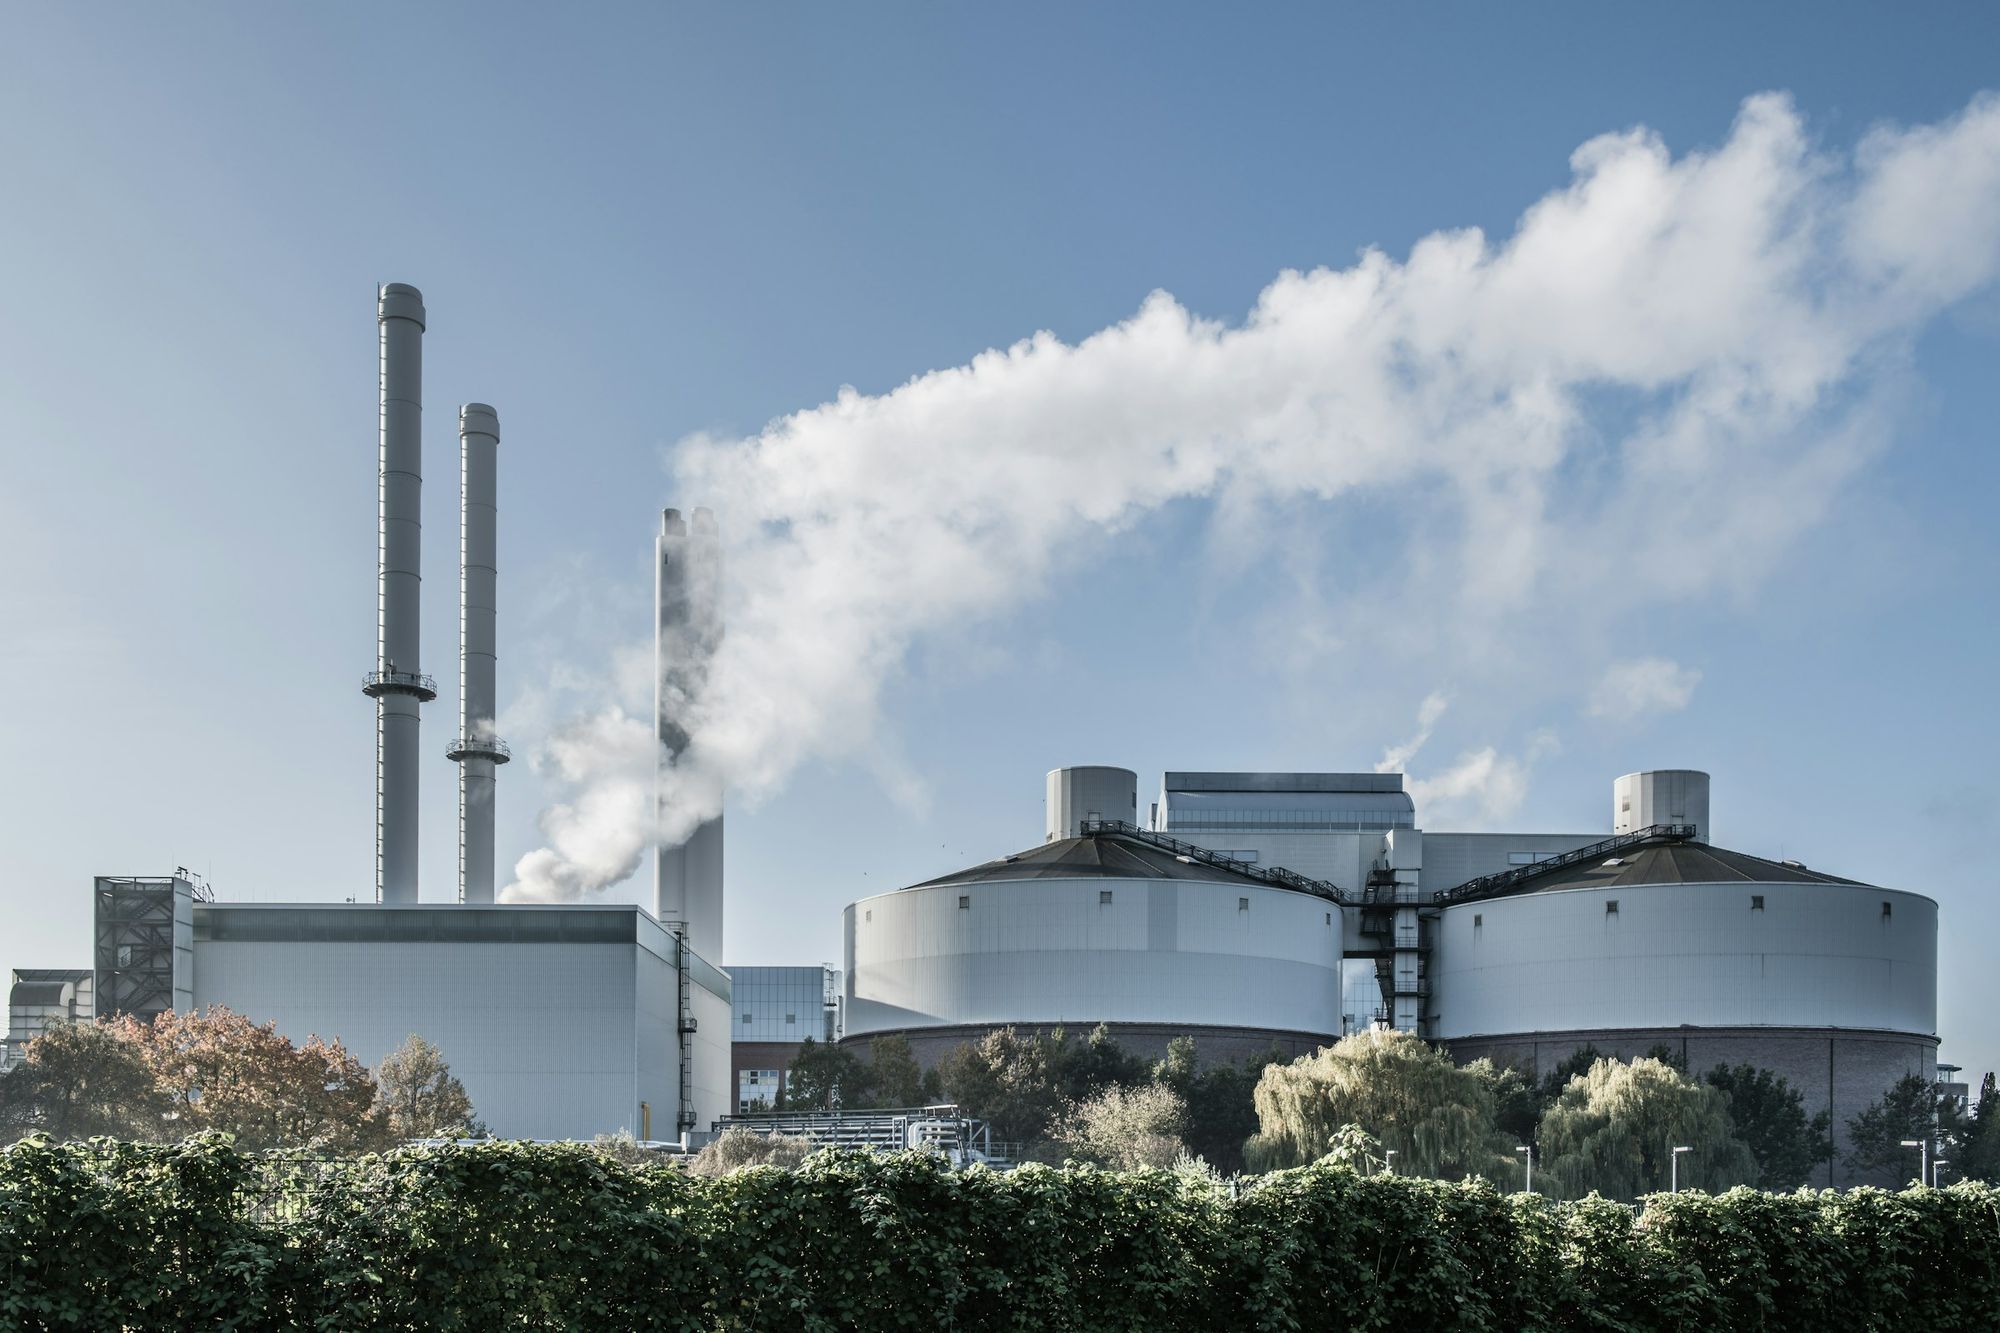
04 Biomass
Heavy plant, tracked work.
Biomass runs on maintenance, so the work and the parts live next to the output.
- Output and energy produced, live
- Task templates and recurring tasks, with a Gantt view
- Spare-parts inventory for the parts you keep on site
- Tickets that record the energy lost while a fault was open
MetersDigital inputsTicket and task PDF reports
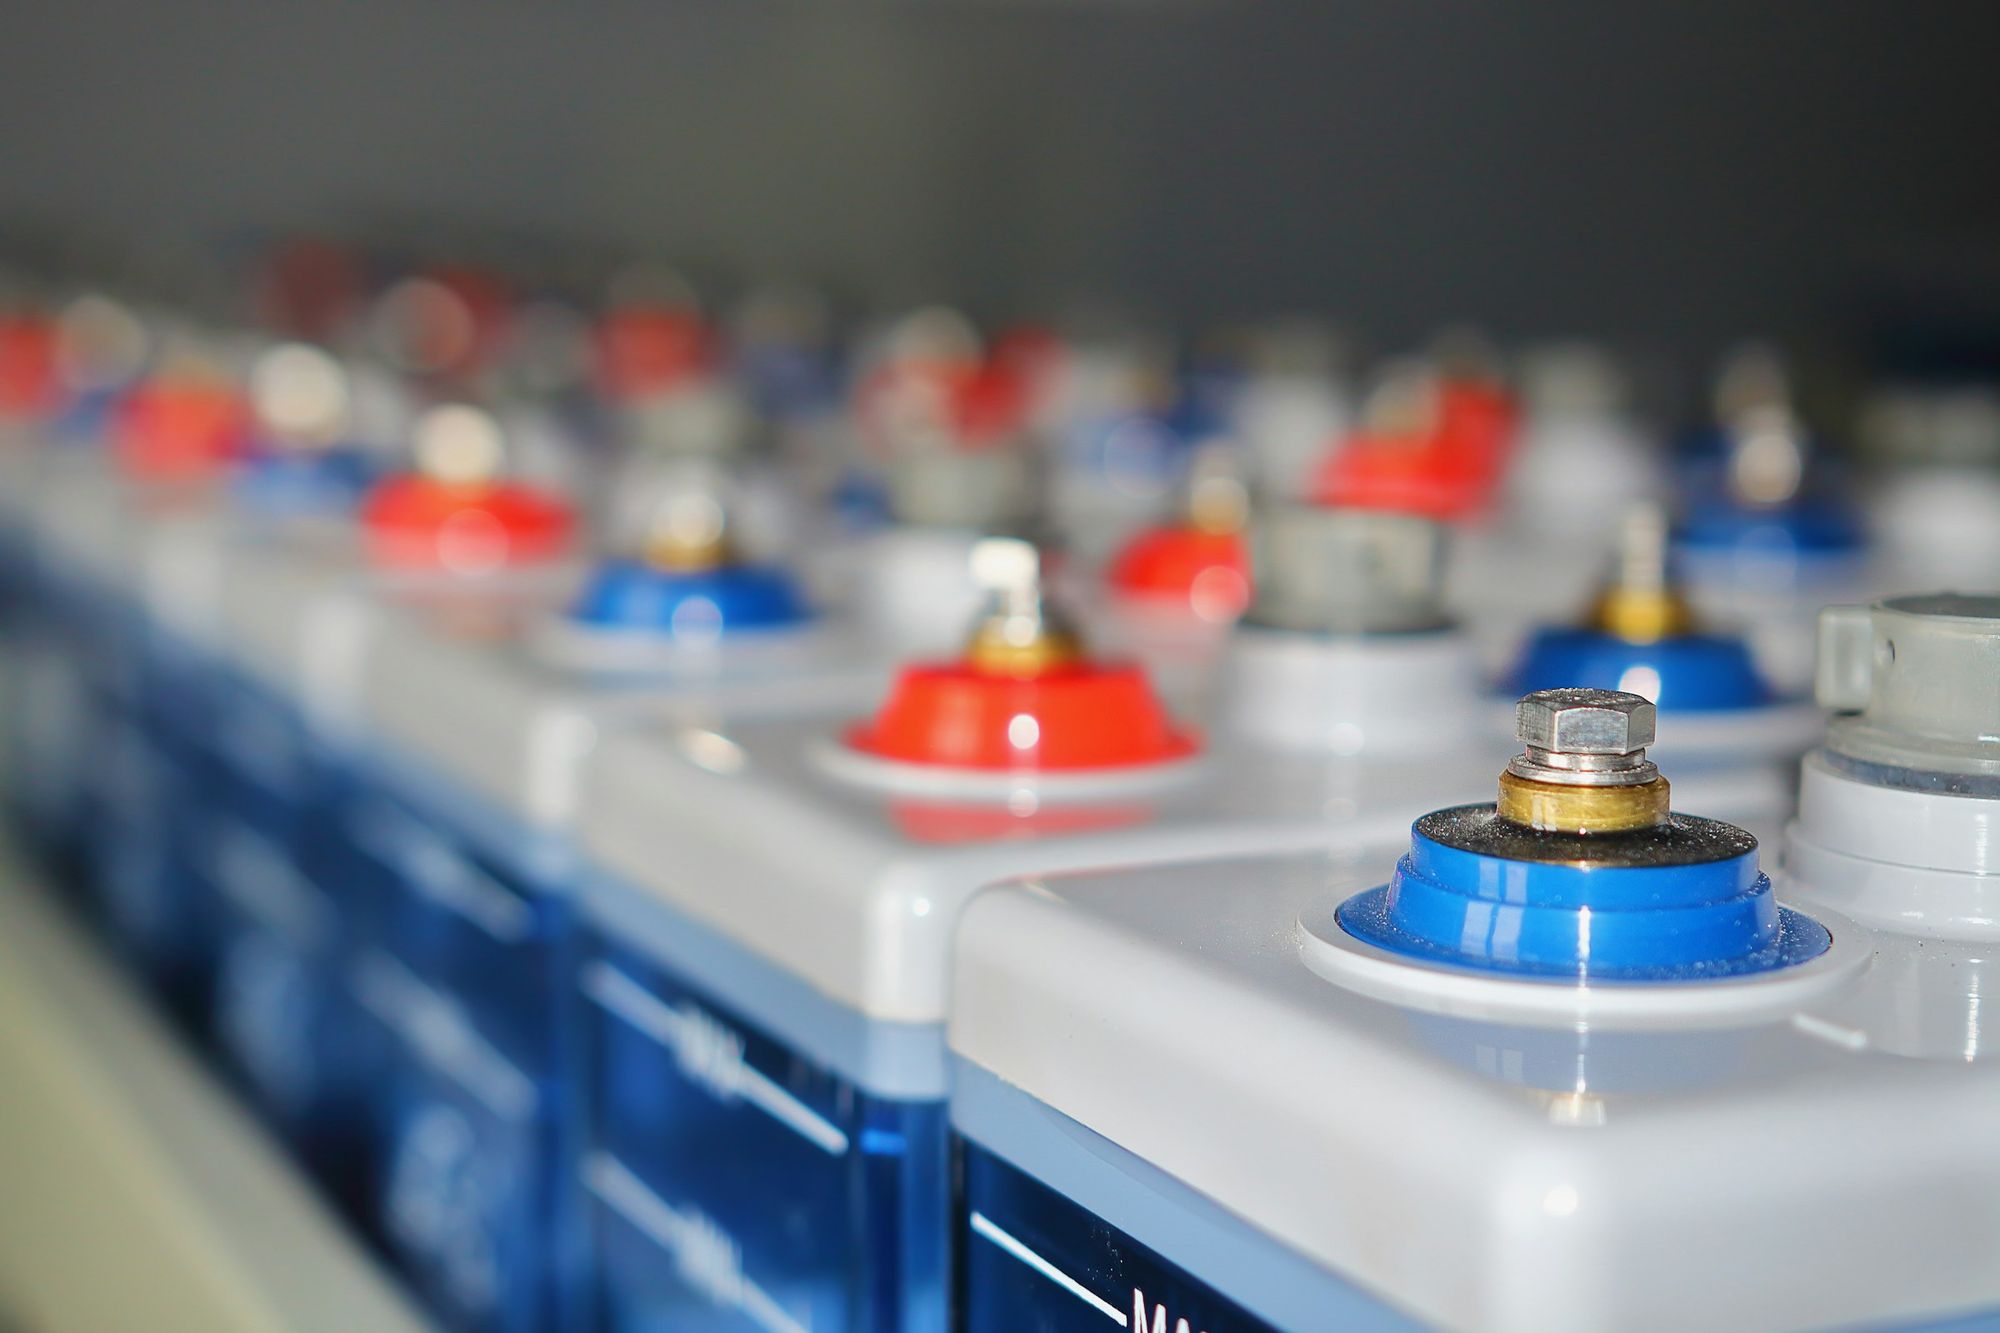
05 Battery storage
Every container, in one view.
See what your batteries are doing and plan when they charge and discharge.
- PCS data from the power conversion system
- BMS data from the battery management system
- Containers set up as part of the plant
- Energy management with charge and discharge scheduling
Alarm rulesCommunication alarmsAnalysis on up to four axes
06 Industrial sites
What you make, use and pay for.
Factories and campuses see generation, consumption and cost together.
- Generator output and site consumption
- Demand and reactive power
- Energy quality from site meters
- AMR meter data and unit prices by month
Custom dashboard pagesAutomated Excel exportsMonthly PDF reports
GridMarshal for industrial sites
Mixed fleet
Bring your whole fleet in.
Bring your solar, wind, hydro, biomass and storage into one walkthrough.