Is it making enough?
A plant can look fine and still make less than it should. Nobody tells you by how much.
Live output for every plant you own, with expected output for every solar inverter.
The questions are simple, but getting the answers is not.
A plant can look fine and still make less than it should. Nobody tells you by how much.
A dirty array or an inverter that restarts each afternoon loses energy for weeks.
Solar, wind and hydro each come with their own system and their own numbers.
Each report works out performance ratio its own way, so plants do not line up.
You hear about faults in messages, with no record of when they were fixed.
Income is worked out each month in a spreadsheet from exported numbers.
One way of measuring, across the whole portfolio.
Data loggers, file imports and the SolarEdge API, with history back-filled.
02 WatchA list and a map of every plant, then down to each inverter.
03 CatchExpected output per inverter compared with actual, with a deviation alarm.
04 FixTickets record the energy lost and who fixed it.
05 ReportPR, availability and earnings in daily and monthly reports.
So one plant can be compared with another, month after month.
Each person sees the plants they are given, nothing more.
Your company, plants, users and settings.
Plant managers who follow output, alarms and work.
Your operations and maintenance (O&M) team or contractor, working tickets and tasks.
Board members, lenders or partners, read-only.
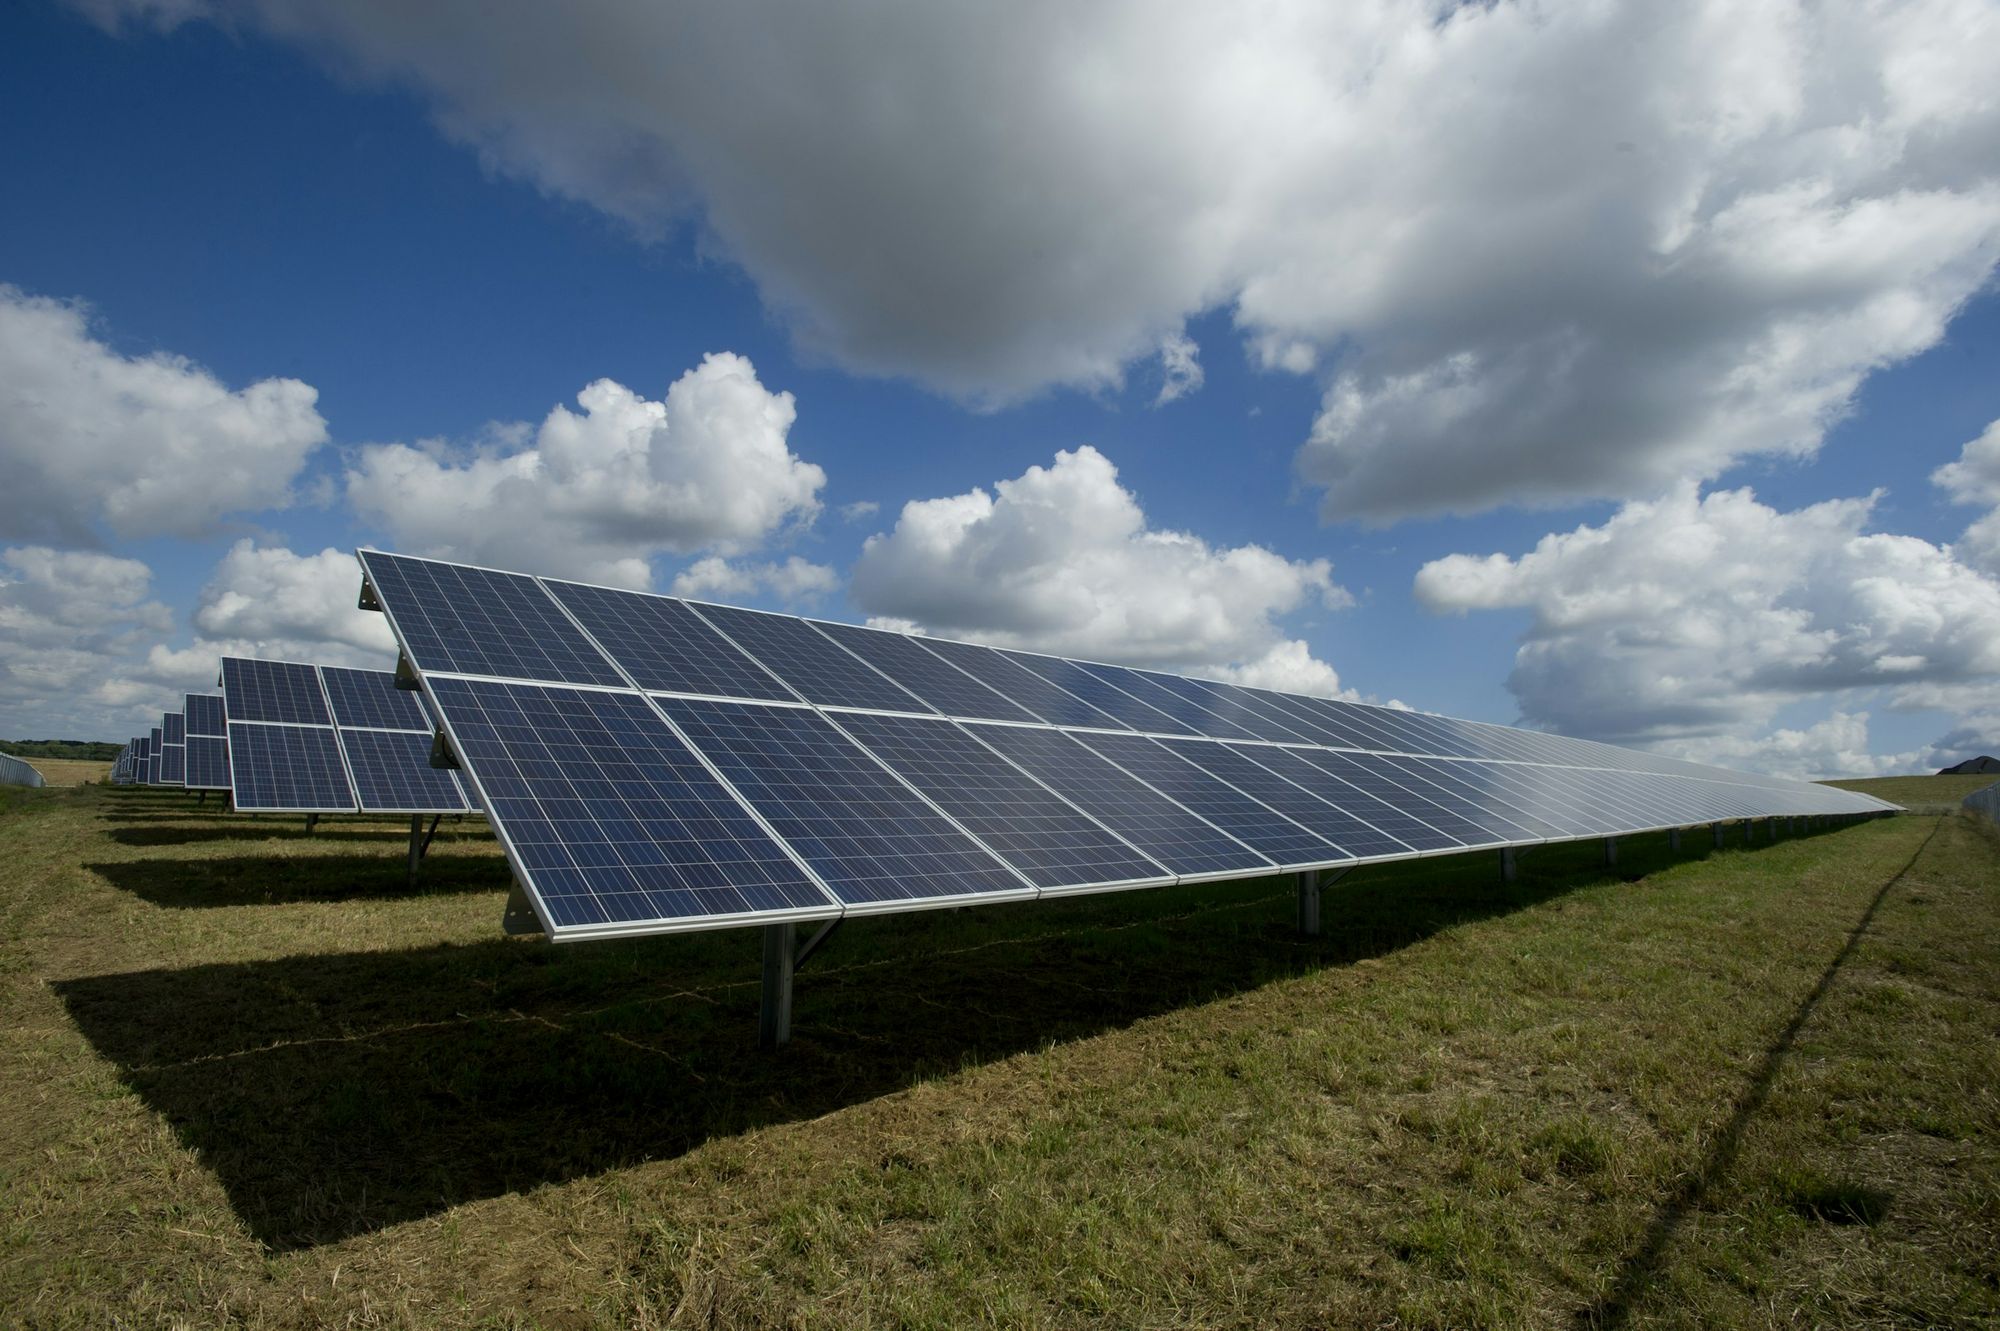
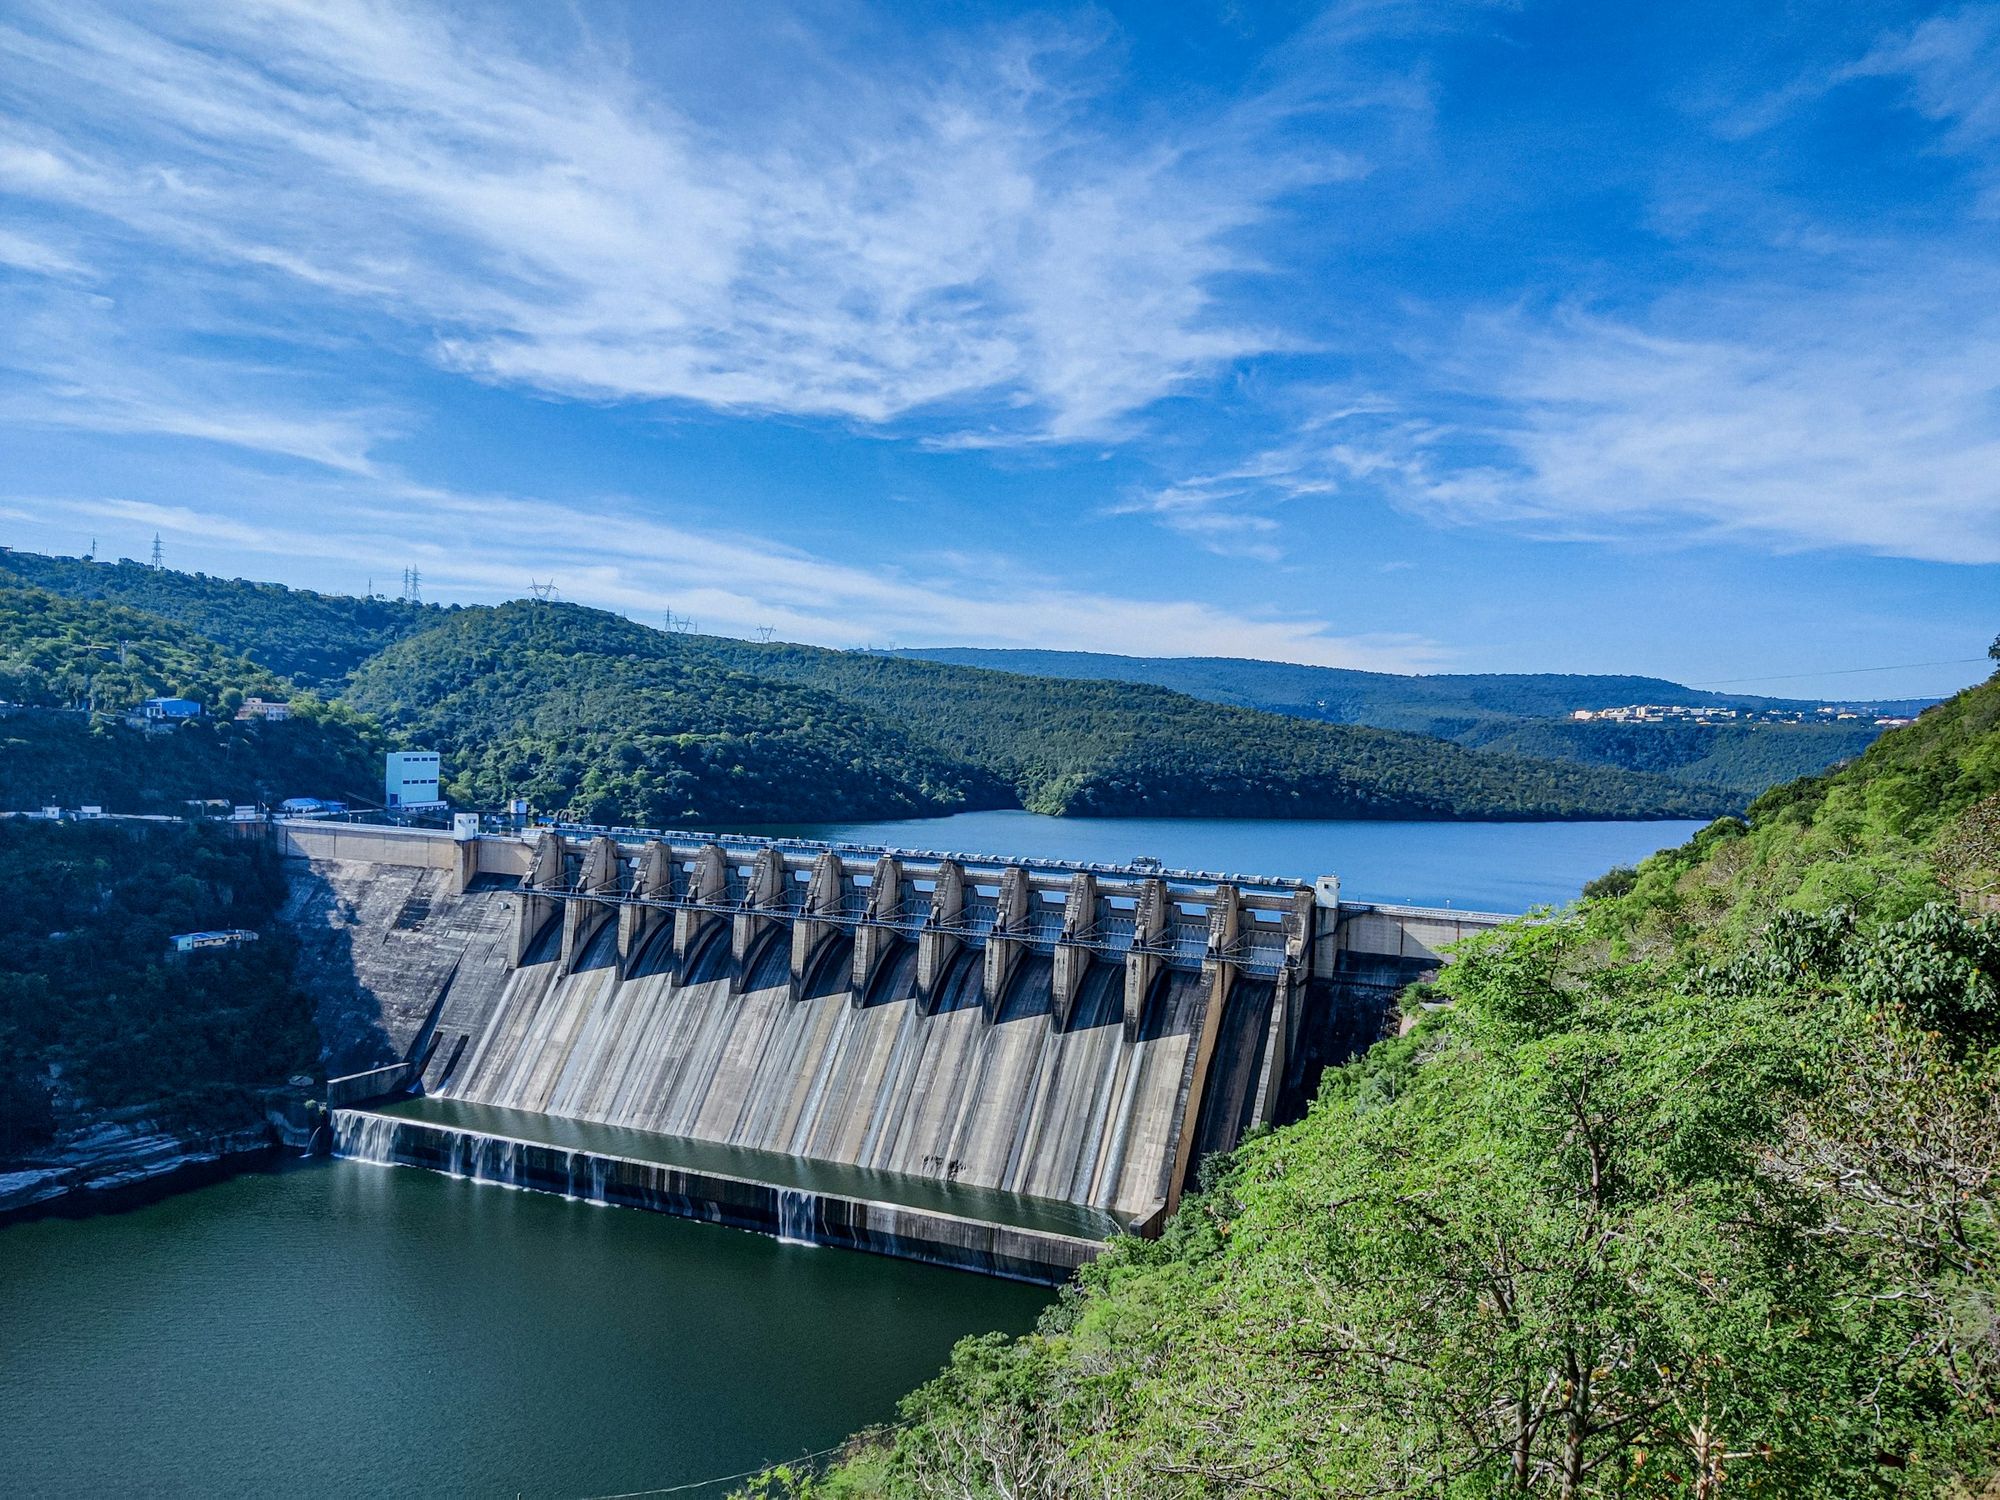
Utility-scale solar, wind, hydro and biomass, side by side.

To IEC 61724-1, with a temperature-corrected PR as well. Every plant uses the same formula.
Expected output is worked out per inverter and compared with actual. A deviation alarm opens when the gap is too large.
Yes. History can be back-filled from files, so reports start with a full record. Our team can do this for you as part of setup.
Yes. Give the contractor's team technician access to your plants, and follow every ticket they work.
A walkthrough of GridMarshal with your portfolio in mind.